Geographies
Code samples use the COUNTY geography. Within the NERDE API other geographies are available including state and tract level data. County level information has the broadest amount of data available with other geographies having more limited data. Using similar URLs you can access the same data aggregated to those specific geographies.
State: Accessed via State FIPS Codes, e.g. '35'- /api/v1/state/explorer/summary
- /api/v1/state/explorer/demographics
- /api/v1/state/explorer/housing
- /api/v1/state/explorer/riskresilience
- /api/v1/tract/explorer/summary
- /api/v1/tract/explorer/demographics
- /api/v1/tract/explorer/housing
- /api/v1/tract/explorer/riskresilience
Tapping into the NERDE API with Python
Welcome to the NERDE API for Python users. Make sure that prior to attempting to connect to the NERDE API, ensure you have registered as a NERDE user at https://nerde.anl.gov . The credentials used for your account will be the values for your username and password.
Table of Contents:- Tapping into the NERDE API with Pyton
- Setting up the Request
- Obtaining an API Token
- Establishing Parameters
- Defining the function to make the data request
- Getting County Level Data
- Summary Data
- Cleaning the Dataframe
- Separate Unemployment data and EDCI indicators and flattened nested dictionaries
- Demographics
- Housing
- Workforce
- Local Economy
- Industry Trends
- Risk & Resilience
- Geographies
Setting up the Request
Obtaining an API Token
import requests
import json
import pandas as pd

call = "https://nerde.anl.gov"

# Pull API Token
response = requests.post(
    url=f"{call}/api/auth/login",
    json={
        "userName": "[email protected]",  # Remember to replace your username
        "password": "password",  # Remember to replace your password
        "rememberMe": True
    }
)
token = response.json()

key = token['result']['token'] # Your unique key
Establishing parameters
# FIPS codes
my_fips = '24011,24013,24015,24017,24019,24021,24023,24025,24027,24029,24031,24033,24035,24039,24037,24041,24043,24045,24047'
# Start and End dates
my_start = '2020-01-01'
my_end = '2023-01-01'
Defining the function to make the data request
def NERDE_API(section_url, fips, startdate, enddate):
    response = requests.get(
        url=f"{call}{section_url}?county_fips={fips}&start_date={startdate}&end_date={enddate}",
        headers={"Authorization": f"Bearer {key}"}
    ).json()

results_summary_digest = []

# Each county will populate a list, this loops through each called county to parse results
    for result in response['result']:
        results_summary_digest.append(result)

        return results_summary_digest
Getting County Level Data
Summary Data
# Create the variable to point to the correct dataset you'd like to pull data from
section_url = "/api/v1/county/explorer/summary"

# API call
summary_digest = NERDE_API(section_url, my_fips, my_start, my_end)

# Create a Pandas DataFrame from summary_digest
main_summary_df = pd.json_normalize(summary_digest)
Our returned dataframe contains binary column data that has been returned as a floating number as well as several missing values. Let's clean that up...
Cleaning the Dataframe
def update_column_values(df, column_name):
    # Replace 1.0 with 'Yes' and NaN with 'No'
    df[column_name] = df[column_name].apply(lambda x: 'Yes' if x == 1.0 else 'No' if pd.isna(x) else x)

    # Set column to string type
    df[column_name] = df[column_name].astype(str)

    return df

main_summary_df = update_column_values(main_summary_df, 'designated_coal_community')
main_summary_df = update_column_values(main_summary_df, 'nuclear_power_plant_present')
Separate Unemploment data and EDCI Indicators and flattened nested dictionaries
# Create function to un-nest columns
def flatten_column_data(df, list_column, county_column='county', code_column='county_fips'):
    flattened_rows = []

    for _, row in df.iterrows():
        county = row[county_column]
        code = row[code_column]
        for entry in row[list_column]:
            flattened_entry = {
                'County': county,
                'Code': code
            }
            # Add all key-value pairs from the dictionary to the flattened entry
            for key, value in entry.items():
                flattened_entry[key] = value
            flattened_rows.append(flattened_entry)

    return pd.DataFrame(flattened_rows)

# Unemployment Data
unemployment_edci_data = main_summary_df[['county', 'county_fips', 'local_24month_unemployment_rate_series', 'edci_data']]

# Create a new unemployment DataFrame with flattened data
flattened_unemployment_data = flatten_column_data(unemployment_edci_data, 'local_24month_unemployment_rate_series')

# EDCI Indicators Data
edci_data = main_summary_df[['county', 'county_fips', 'edci_indicators']]

# Create a new EDCI DataFrame with flattened data
flattened_edci_data = flatten_column_data(edci_data, 'edci_indicators')
Tip
If you run into `KeyError: 'result'` the API Key has expired and you should re-run the section [Obtaining an API Token](#obtaining-an-api-token)
Demographics
# Demographics API end point
demographics_url="/api/v1/county/explorer/demographics"

# Calling the API
demographics_digest = NERDE_API(demographics_url, my_fips, my_start, my_end)

# Turn response into Dataframe
demographics_df = pd.json_normalize(demographics_digest)

# Annual Demographics Dataframe
demographics_nested_df = demographics[['county', 'county_fips', 'annual_demographics']]

# Annual Demographics Un-nested
demographics_annnual_df = flatten_column_data(demographics_annual, 'annual_demographics')
Housing
#Housing API end point
housing_url="/api/v1/county/explorer/housing"

# Calling the API
housing_digest = NERDE_API(housing_url, my_fips, my_start, my_end)

# Turn response into Dataframe
housing_df = pd.json_normalize(housing_digest)
Workforce
# Workforce API end point
workforce_url = "/api/v1/county/explorer/workforce"

# Calling the API
workforce_digest = NERDE_API(workforce_url, my_fips, my_start, my_end)

# Turn response into Dataframe
workforce_df = pd.json_normalize(workforce_digest)

# Monthly Economic Statistics Dataframe
workforce_monthly_stats = workforce_df[['county', 'county_fips', 'monthly_economic_stats']]

# Monthly Economic Statistics Un-nested
workforce_monthly_stats_flattened = flatten_column_data(workforce_monthly_stats, 'monthly_economic_stats')
Local Economy
# Local Economy URL
localeconomy_url = "/api/v1/county/explorer/localeconomy"

# Calling the API
localeconomy_digest = NERDE_API(localeconomy_url, my_fips, my_start, my_end)

# Turn response into Dataframe
localeconomy_df = pd.json_normalize(localeconomy_digest)

# Industry Employment Dataframe
localeconomy_industry_employment_series = localeconomy_df[['county', 'county_fips', 'state', 'industry_employment_series']]

# Industry Employment Un-nested
localeconomy_industry_employment_series_flattened = flatten_column_data(localeconomy_industry_employment_series, 'industry_employment_series')

# Industry GDP Dataframe
localeconomy_industry_gdp_series = localeconomy_df[['county', 'county_fips', 'state', 'industry_gdp_series']]

# Industry GDP Un-nested
localeconomy_industry_gdp_series_flattened = flatten_column_data(localeconomy_industry_gdp_series, 'industry_gdp_series')
Industry Trends
# Industry Trends URL
industrytrends_url="/api/v1/county/explorer/industrytrends"

# Calling the API
industry_digest = NERDE_API(industrytrends_url, my_fips, my_start, my_end)

# Turn response into Dataframe
industry_df = pd.json_normalize(industry_digest)

# Industry Employment Dataframe
industry_location_quotient_series_df = industry_df[['county', 'county_fips', 'location_quotient_series']]

# Industry Employment Un-nested
industry_location_quotient_series_df_flattened = flatten_column_data(industry_location_quotient_series_df, 'location_quotient_series')
Risk And Resilience
# Rist and Resilience URL
risk_url="/api/v1/county/explorer/riskresilience"

# Calling the API
risk_digest = NERDE_API(risk_url, my_fips, my_start, my_end)

# Turn response into Dataframe
risk_df = pd.json_normalize(risk_digest)

# Rename Column
risk_df.rename(columns={"geo_fips": "county_fips"}, inplace=True)

# Risk FEMA Disaster Declarations Dataframe
risk_fema_disaster_dec_df = risk_df[['county', 'county_fips', 'fema_disaster_declarations']]

# Risk FEMA Disaster Declarations Un-nested
risk_fema_disaster_dec_df_flatten = flatten_column_data(risk_fema_disaster_dec_df, 'fema_disaster_declarations')
Tapping into the NERDE API
Welcome to the NERDE API for R users. Make sure that prior to attempting to connect to the NERDE API, ensure you have registered as a NERDE user at https://nerde.anl.gov/auth/login . The credentials used for your account will be the values for your Username and Password.
Table of Contents:
- Obtaining an API Token
- County Summary Data
- Demographics
- Housing
- Workforce
- Local Economy
- Industry Trends
- Risk & Resilience
Obtaining an API Token
library(jsonlite)
library(httr)

call <- "https://nerde.anl.gov"

# Pull API Token
token <- fromJSON( #transforms content to JSON
  content( #retrieves POST content
  POST(url=paste0(call,"/api/auth/login"),
       ## Remember to replace your username and password below
       body=list(userName="[email protected]", password="password", rememberMe=TRUE),
       encode = "json"),
     "text",
     encoding = "UTF-8"))

# Your unique key
key <- token$result$token

# Establishing fips and start and end dates for collection (start and end dataes are not often used)
my_fips <- "24011,24013,24015,24017,24019,24021,24023,24025,24027,24029,24031,24033,24035,24039,24037,24041,24043,24045,24047"
fips_length <- lengths(regmatches(my_fips,gregexpr(",",my_fips)))+1
my_start <- "2020-01-01"
my_end <- "2023-01-01"
# r Retrieve Results function
NERDE_API <- function(section_url,fips){
  results_summary <- content(GET(url=paste0(call,section_url,"?county_fips=",fips),
    add_headers(key)))

results_summary_digest <- list()
## Each county will populate a list, this loops through each called county to parse results
for (i in 1:length(results_summary$result)){
x <- results_summary$result[[i]]
results_summary_digest <- c(results_summary_digest,x)
}
return(results_summary_digest)
}
County Summary Data
# r County Summary
section_url <- "/api/v1/county/explorer/summary"

summary_digest <- NERDE_API(section_url = section_url,fips=my_fips)
## Creating a data frame for special needs characteristics

# Remove EDCI and Local 24 month Unemployment
sp_need_vars <- c(grep("local",summary_digest),grep("local",summary_digest)-1)

# Unnesting API results
sp_need <- data.frame(stack(summary_digest[-sp_need_vars]))
sp_need$ind <- as.character(sp_need$ind)

#initial data frame for loop (does not pull in coal community information)
mycol <- unique(sp_need$ind)[1]
special_needs <- data.frame(mycol=sp_need[sp_need$ind==mycol,1])

# loop to populate data frame with special needs characteristics
for (i in 2:length(unique(sp_need$ind))){
  mycol <- unique(sp_need$ind)[i]
  l <- data.frame(sp_need[sp_need$ind==mycol,1])
  names(l) <- mycol
  ifelse(nrow(l)==fips_length,
         special_needs <- cbind(special_needs,l),

         #coal community data is a special case due to the fact that those communities that are not designated as coal communities do not pull information for this field. The following code works to identify those counties and accurately describe them as coal communities or not.
         {
         f <- data.frame(sp_need[sp_need$ind %in% c("county",mycol),1])
         cc <- grepl("County",f$sp_need.sp_need.ind..in..c..county...mycol...1.)
         cc <- !c(cc[-1],TRUE)
         cc <- cbind(f,cc)
         names(cc) <- c("county",mycol)
         cc <- cc[grepl("County",cc$county)==TRUE,]
         special_needs <- cbind(special_needs,cc[,mycol])
         names(special_needs)[ncol(special_needs)] <- mycol
         }
         )


}
# r 24 month unemployment
# 24 month unemployment data cleaning - unemployment data is calculated in aggregate for the selection so all of your selected counties will be summarized for a single month

unemp_24mo_raw <- summary_digest$local_24month_unemployment_rate_series
m <- unlist(unemp_24mo_raw)
unemp_24mo <-stack(m)

timestamps <- unemp_24mo[unemp_24mo$ind=="timestamp",1]
values <-unemp_24mo[unemp_24mo$ind=="value",1]
values <- c(rep(NA,length(timestamps)-length(values)),values)

unemp_24mo <- data.frame(timestamps,values)
Demographics
demographics_digest <- NERDE_API(section_url = "/api/v1/county/explorer/demographics", fips=my_fips)

#print listed variables that need a seprate ingest function
unique(names(demographics_digest[sapply(demographics_digest,is.list)==TRUE]))
# Unnesting API results

demographics_digest <- data.frame(stack(demographics_digest[sapply(demographics_digest,is.list)==FALSE]))
demographics_digest$ind <- as.character(demographics_digest$ind)

mycol <- unique(demographics_digest$ind)[1]
demographics <- data.frame(mycol=demographics_digest[demographics_digest$ind==mycol,1])

# loop to populate data frame with special needs characteristics
for (i in 2:length(unique(demographics_digest$ind))){
  mycol <- unique(demographics_digest$ind)[i]
  l <- data.frame(demographics_digest[demographics_digest$ind==mycol,1])
  names(l) <- mycol
  demographics <- cbind(demographics,l)
         }
Housing
housing_digest <- NERDE_API(section_url = "/api/v1/county/explorer/housing", fips=my_fips)
unique(names(housing_digest[sapply(housing_digest,is.list)==TRUE]))
# Unnesting API results

housing_digest <- data.frame(stack(housing_digest[sapply(housing_digest,is.list)==FALSE]))
housing_digest$ind <- as.character(housing_digest$ind)

mycol <- unique(housing_digest$ind)[1]
housing <- data.frame(mycol=housing_digest[housing_digest$ind==mycol,1])

# loop to populate data frame
for (i in 2:length(unique(housing_digest$ind))){
  mycol <- unique(housing_digest$ind)[i]
  l <- data.frame(housing_digest[housing_digest$ind==mycol,1])
  names(l) <- mycol
  housing <- cbind(housing,l)
}
Workforce
workforce_digest <- NERDE_API(section_url = "/api/v1/county/explorer/workforce", fips=my_fips)
unique(names(workforce_digest[sapply(workforce_digest,is.list)==TRUE]))
# Unnesting API results

workforce_digest <- data.frame(stack(workforce_digest[sapply(workforce_digest,is.list)==FALSE]))
workforce_digest$ind <- as.character(workforce_digest$ind)

mycol <- unique(workforce_digest$ind)[1]
workforce <- data.frame(mycol=workforce_digest[workforce_digest$ind==mycol,1])

# loop to populate data frame
for (i in 2:length(unique(workforce_digest$ind))){
  mycol <- unique(workforce_digest$ind)[i]
  l <- data.frame(workforce_digest[workforce_digest$ind==mycol,1])
  names(l) <- mycol
  workforce <- cbind(workforce,l)
}
Local Economy
l_econ_digest <- NERDE_API(section_url = "/api/v1/county/explorer/localeconomy", fips=my_fips)
unique(names(l_econ_digest[sapply(l_econ_digest,is.list)==TRUE]))
# Unnesting API results

l_econ_digest <- data.frame(stack(l_econ_digest[sapply(l_econ_digest,is.list)==FALSE]))
l_econ_digest$ind <- as.character(l_econ_digest$ind)

mycol <- unique(l_econ_digest$ind)[1]
local_econ <- data.frame(mycol=l_econ_digest[l_econ_digest$ind==mycol,1])

# loop to populate data frame
for (i in 2:length(unique(l_econ_digest$ind))){
  mycol <- unique(l_econ_digest$ind)[i]
  l <- data.frame(l_econ_digest[l_econ_digest$ind==mycol,1])
  names(l) <- mycol
  local_econ <- cbind(local_econ,l)
}
Industry Trends
industry_digest <- NERDE_API(section_url = "/api/v1/county/explorer/industrytrends", fips=my_fips)
unique(names(industry_digest[sapply(industry_digest,is.list)==TRUE]))

# Unnesting API results

industry_digest <- data.frame(stack(industry_digest[sapply(industry_digest,is.list)==FALSE]))
industry_digest$ind <- as.character(industry_digest$ind)

mycol <- unique(industry_digest$ind)[1]
industry <- data.frame(mycol=industry_digest[industry_digest$ind==mycol,1])

# loop to populate data frame
for (i in 2:length(unique(industry_digest$ind))){
  mycol <- unique(industry_digest$ind)[i]
  l <- data.frame(industry_digest[industry_digest$ind==mycol,1])
  names(l) <- mycol
  industry <- cbind(industry,l)
}
Risk and Resilience
risk_digest <- NERDE_API(section_url = "/api/v1/county/explorer/riskresilience", fips=my_fips)
unique(names(risk_digest[sapply(risk_digest,is.list)==TRUE]))

# Unnesting API results

risk_digest <- data.frame(stack(risk_digest[sapply(risk_digest,is.list)==FALSE]))
risk_digest$ind <- as.character(risk_digest$ind)

mycol <- unique(risk_digest$ind)[1]
risk <- data.frame(mycol=risk_digest[risk_digest$ind==mycol,1])

# loop to populate data frame with special needs characteristics
for (i in 2:length(unique(risk_digest$ind))){
  mycol <- unique(risk_digest$ind)[i]
  l <- data.frame(risk_digest[risk_digest$ind==mycol,1])
  names(l) <- mycol
  risk <- cbind(risk,l)
}
Power BI Tutorial
- Power BI Tutorial
- What is needed
- Windows Python Installation
- Setting up Python on Power BI Desktop
- Opening the Python Script Window
- Basic Example Code to call the NERDE API
- Single Dataframe Request
- Multiple Dataframe Request
- Demographics Example
- Visualizations
- Power BI Charts
- Python Charts
- Geographies
- Notes
What is needed
- Power BI Desktop
- Python installation
- Installed Python libraries (eg. Requests, Pandas, Matplotlib, etc.)
- Username and Password for NERDE API
Windows Python Installation
- Python.org install: Standard Python - Windows
- Anaconda Install: Anaconda Installation (Recommended)
Setting up Python on Power BI Desktop
Open Power BI and go to File > Options and settings > Options. In the left-hand menu select `Python scripting`
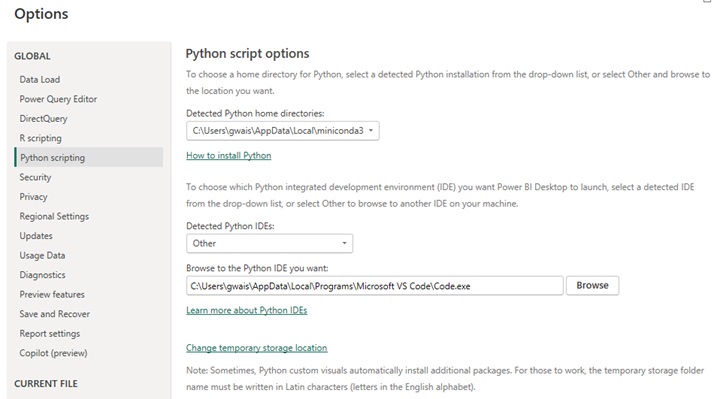
Make sure that Power BI is pointing to the correct python installation, then click `OK`.
Optionally, if you have a Python IDE installed you may input its path as well.
Opening the Python Script Window
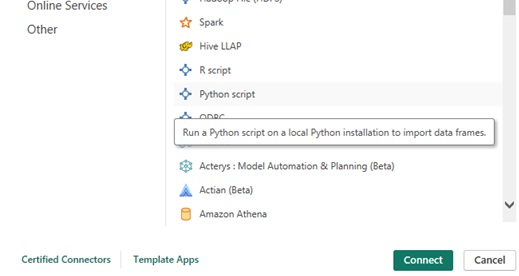
Within Power BI Desktop, click on Get data > Other
Select `Python Script` then click `Connect`.
Now your `Python script` window will appear.
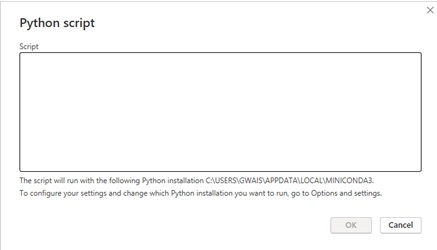
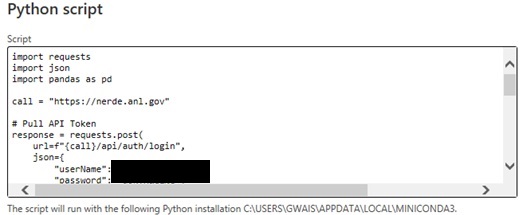
The python script windows is not ideal for creating your code but you can copy and paste your code into the window and it will work as expected assuming you are pointing to the correct python installation or environment.
Basic Example Code to call the NERDE API
import requests
import json
import pandas as pd

call = "https://nerde.anl.gov"

# Pull API Token
response = requests.post(
    url=f"{call}/api/auth/login",
    json={
        "userName": "[email protected]",  # Remember to replace your username
        "password": "password",  # Remember to replace your password
        "rememberMe": True
    }
)
token = response.json()

key = token['result']['token'] # Your unique key

# My Parameters
my_fips = '24011,24013,24015,24017' # FIPS codes

# Start and End dates
my_start = '2020-01-01'
my_end = '2023-01-01'

def NERDE_API(section_url, fips, startdate, enddate):
    response = requests.get(
        url=f"{call}{section_url}?county_fips={fips}&start_date={startdate}&end_date={enddate}",
        headers={"Authorization": f"Bearer {key}"}
    ).json()

    results_summary_digest = []

    # Each county will populate a list, this loops through each called county to parse results
    for result in response['result']:
        results_summary_digest.append(result)

    return results_summary_digest

# Create the variable to point to the correct dataset you'd like to pull data from
section_url = "/api/v1/county/explorer/summary"

# API call
summary_digest = NERDE_API(section_url, my_fips, my_start, my_end)

# Create a Pandas DataFrame from summary_digest
main_summary_df = pd.json_normalize(summary_digest)
Single Dataframe Request
We can copy and paste the example code above (making sure to change the Username and Password). Here we are importing required libraries then ask the API for Summary data on specific FIPS codes. Once you click `Connect` Power BI will process that authorization and data via Python.

Here we can see the Dataframe we requested.

We've only requested one DataFrame in this example, but Power BI will allow you to pull-up multiple DataFrames in a single script.
Multiple Dataframe Request
Using the same set up, Power BI will detect multiple dataframes within the python code.
In the script below we have requested data from the Demographics end point. Additionally, we will do some data transformation and create a separate Dataframe of Annual Demographics prior to importing into PowerBI.
Demographics Example
Python variables
my_fips = '13001' # FIPS codes

# Start and End dates
my_start = '2016-01-01'
my_end = '2023-01-01'

# Demographics API end point
demographics_url = "/api/v1/county/explorer/demographics"
Call the API & create dataframe
# Calling the API
demographics_digest = NERDE_API(demographics_url, my_fips, my_start, my_end)

# Turn main portion of returned data into a Dataframe
main_demographics_df = pd.json_normalize(demographics_digest)

# A function to flatten any columns that are nested and return a Dataframe
def flatten_column_data(df, list_column, county_column='county', code_column='county_fips'):
    flattened_rows = []

    for _, row in df.iterrows():
        county = row[county_column]
        code = row[code_column]
        for entry in row[list_column]:
            flattened_entry = {
                'County': county,
                'Code': code
            }
            # Add all key-value pairs from the dictionary
            for key, value in entry.items():
                flattened_entry[key] = value
            flattened_rows.append(flattened_entry)

    return pd.DataFrame(flattened_rows)

# Annual Demographics
demographics_annual = demographics[['county', 'county_fips', 'annual_demographics']]

demographics_annual_flattened = flatten_column_data(demographics_annual, 'annual_demographics')
Input the code in the Python Power BI Python window and click `OK`.
Results from code:

Now that the data is in Power BI you can further update the table using Power Query Editor or create visualizations and reports.
Visualizations
Power BI Charts
From the Navigator, select a dataframe. In thise case we will select demographics_annual_flattened. Then click Trasform Data. By Clicking Transform Data instead of Load, Power BI will import the data into its query editor and convert the columns into the appropriate column type which will be neccessary to create graphs and charts.
If you are satisfied with the automated column type selections, click Apply in the upper left-hand corner and the data will load into Power BI.
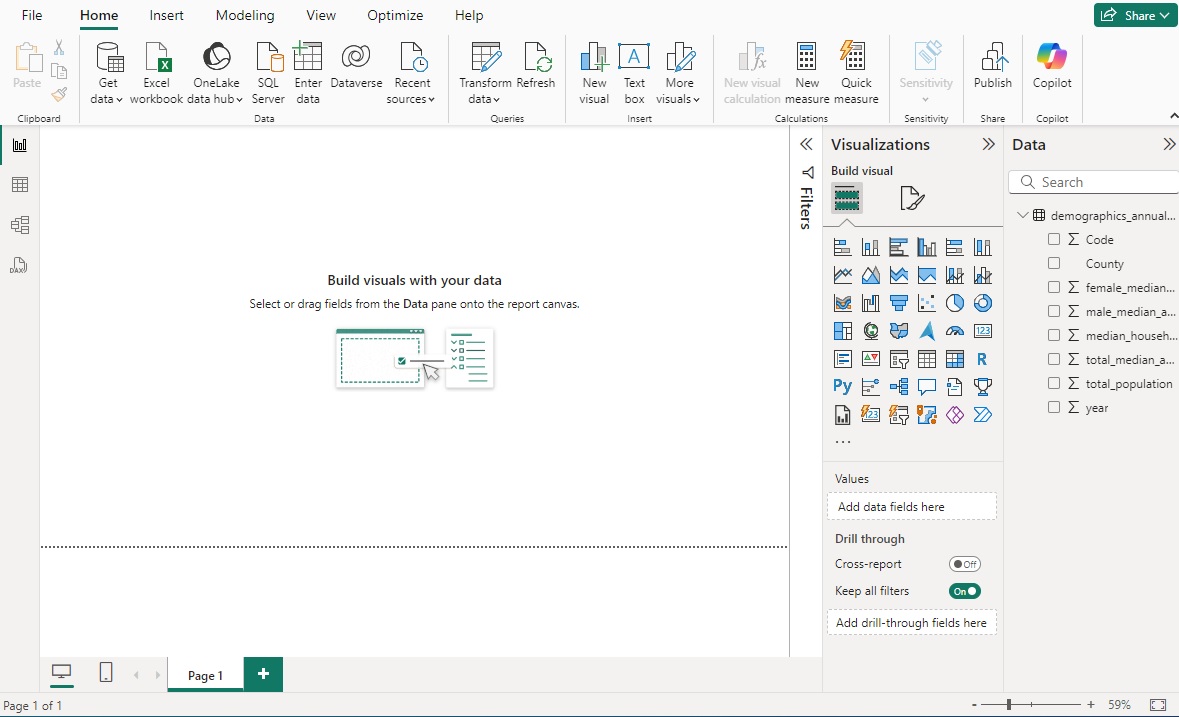
If you see a $\sum$ symbol in front of the column name on the right-hand side then that column has been formatted as a numeric data type and can therefore be used in a chart.
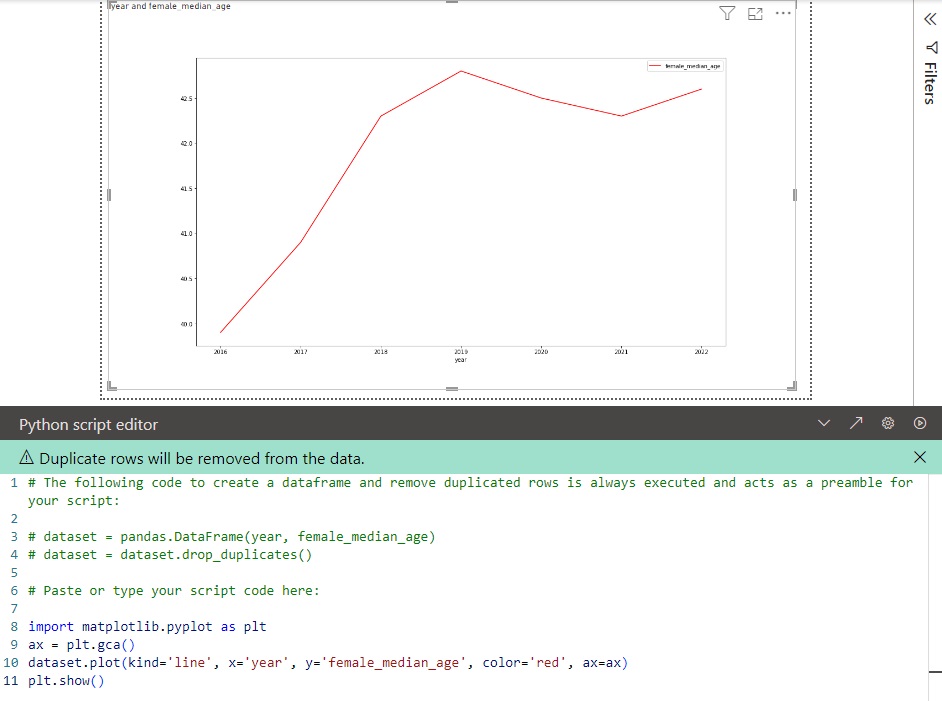
Power BI makes it fairly straightforward to create simple charts. Under Visualizations you will see a variety of chart types. For simplicity we will use the line chart. Click the line chart icon and it will open a placeholder on the main page.
Now click on the checkboxes next to the variables that you will use to populate the chart. For this example we will use female_median_age and year. Power BI sometimes drops those variables in the wrong boxes but you can easily move them around by clicking and dragging.
Here is an image of the chart you should see
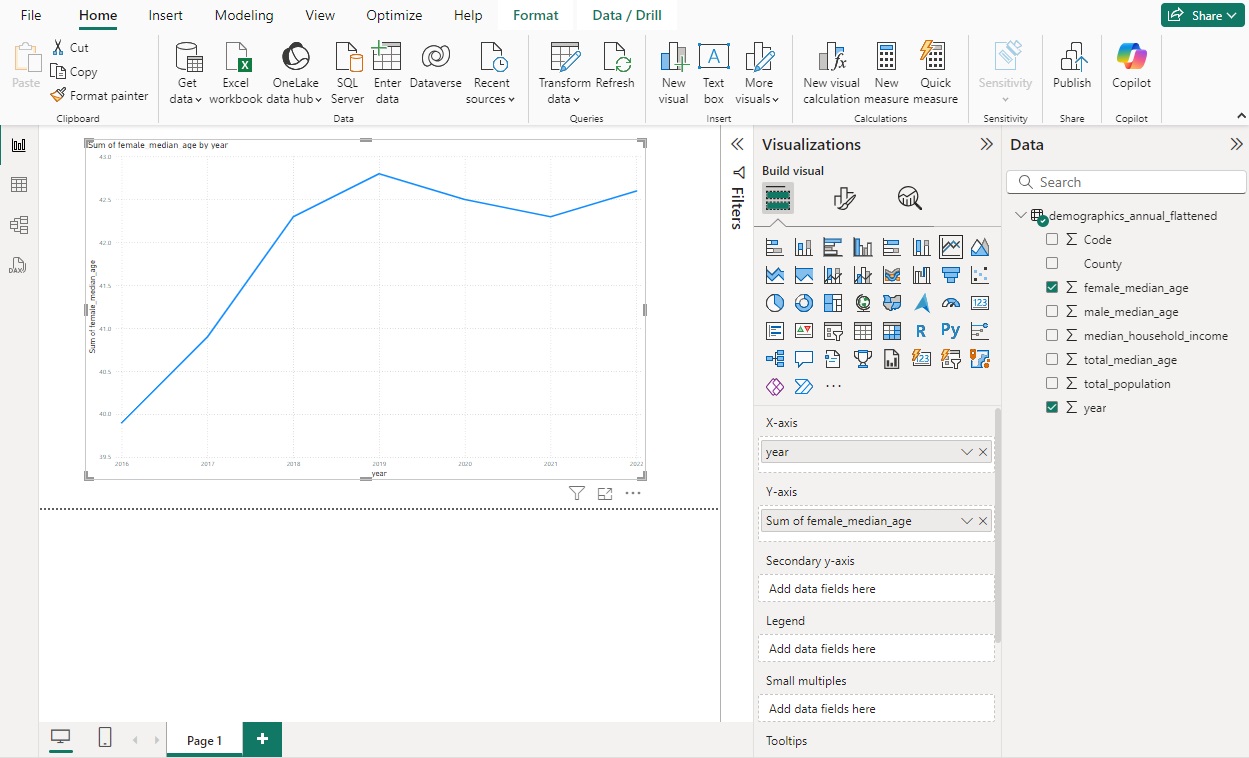
Your charts and options should look similar to this.
Note
You may notice that the Y-axis has been set to the sum of female_median_age. Power BI does not give you the option to use the simple value of the column. In our case we only have 1 value per year so using sum, min, or max would all yield the same result as the simple value for each year. But this is something to consider if there are multiple values per year. When using these charts in a presentation confusion can be avoided by renaming the Y-axis.
Python Charts
Under Visualizations you can also select Python visual to build you own charts with specific python pakages. (Please see the note on Power BI's limitations below to understand what packages are acceptable). With the same dataframe that was imported earlier, we can select Python visual and if not already enabled, enable script visuals.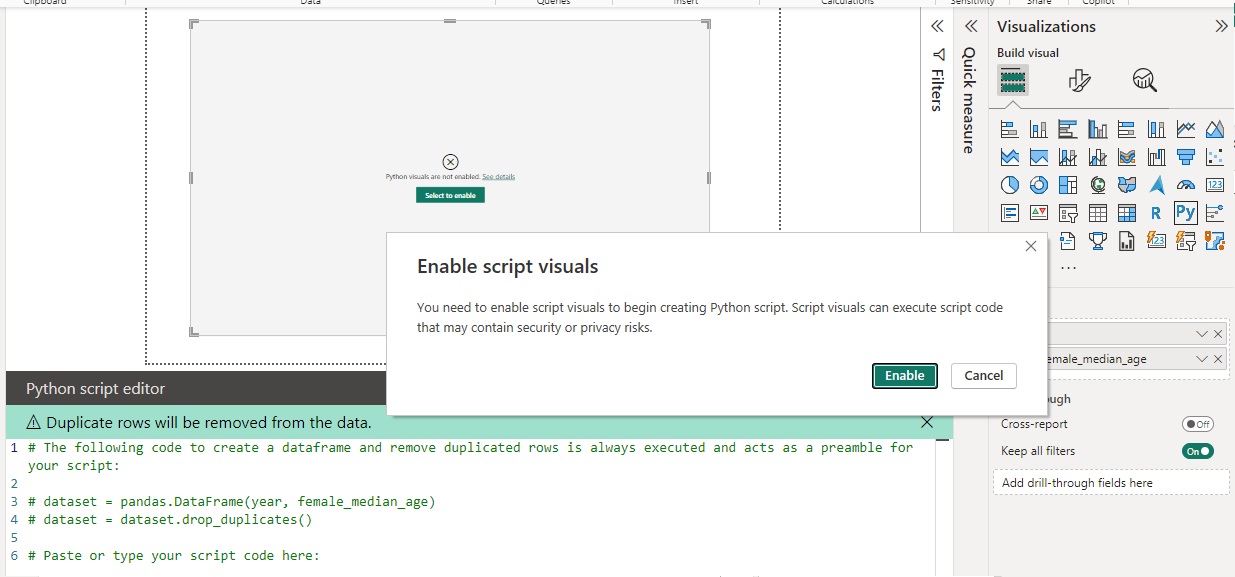 Once enabled drag the columns that you would like to visual into the `Values` box. And Power BI will pre-populate a dataset for you.
Note
In this instance using Python visuals allows you to select Don't Summarize in the Values box.
>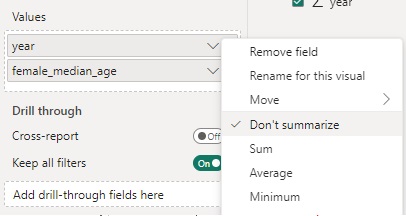 In the Python script editor you can copy and past the following code to see an example of the chart. Once the code is in press the Run script button to display the chart.
Import additional python libraries
import matplotlib.pyplot as plt
ax = plt.gca()
dataset.plot(kind='line', x='year', y='female_median_age', color='red', ax=ax)
plt.show()
